In late October, semiconductor giant Nvidia Corp. (ticker: NVDA) added another milestone to its list of achievements, becoming the first company in history to reach a $5 trillion market capitalization.
Market cap is calculated by multiplying a company’s share price by its total number of outstanding shares. While it is an imperfect measure, investors often view it as a key indicator of success.
But beyond its lineup of essential graphics processing units (GPUs) powering AI data centers and cloud computing hyperscalers, Nvidia’s meteoric rise reflects three dominant trends shaping today’s equity markets: size, style and sector.
In terms of size, decades of research once suggested that smaller companies should outperform larger ones over time. Yet, since the 2008 financial crisis, the opposite has occurred. Large-cap stocks have led the market, propelled by global scale, balance sheet strength and broader access to capital.
In terms of style, the dominance has come not from value stocks but from growth companies – those trading at higher valuations such as price-to-earnings and price-to-sales ratios because investors expect rapid earnings and revenue expansion and are willing to pay a premium.
Finally, this outperformance has been concentrated within the technology sector, which now makes up more than a third of the S&P 500 and over half of the Nasdaq-100. The trend also extends to “tech-adjacent” industries such as communications services and consumer discretionary, with names like Alphabet Inc. (GOOG, GOOGL) and Amazon.com Inc. (AMZN) blurring traditional sector lines.
If you sort mutual funds from asset managers such as Vanguard, Charles Schwab or Fidelity by their trailing 10-year returns, you will likely find Nvidia and other large-cap, growth-oriented tech stocks among the top holdings. However, experts warn that past outperformers may not remain future leaders.
“Dumping money into the winners of the last decade means you’re deliberately buying what is now expensive compared to the rest of the market, which bodes poorly for expected returns,” says Allen Mueller, director of financial planning at 7 Saturdays Financial.
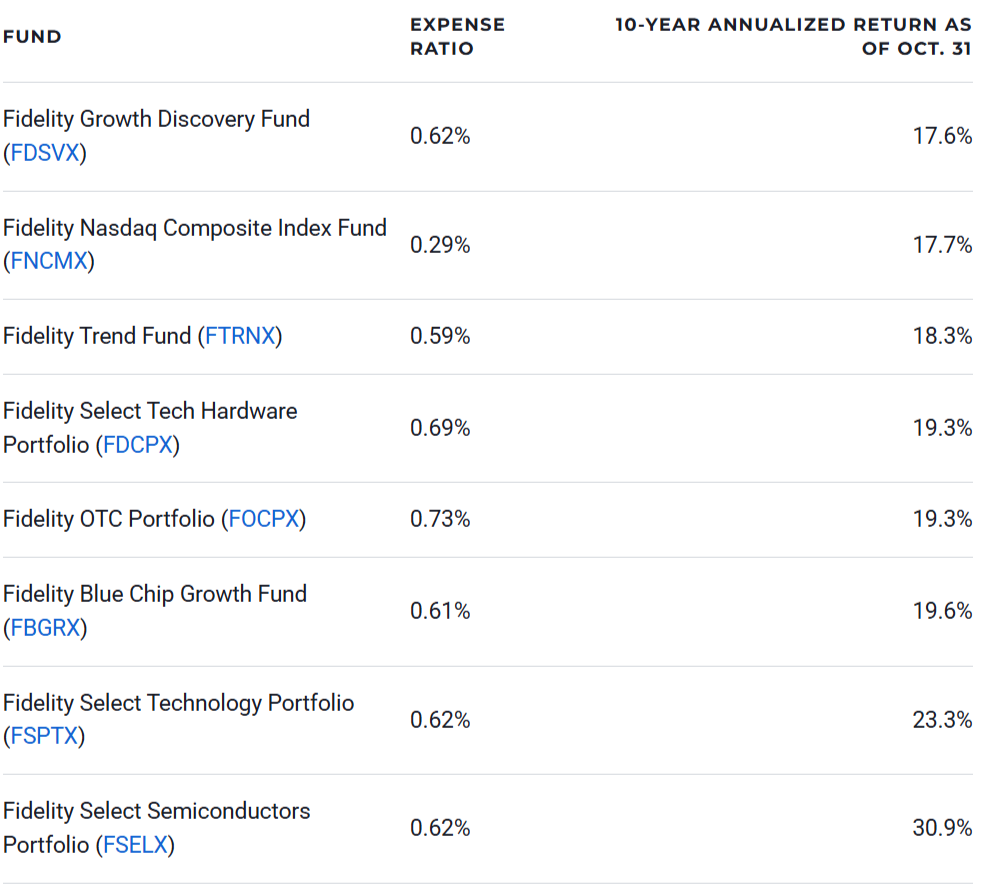
With that in mind, here’s a look at the top eight Fidelity mutual funds, ranked in ascending order by their trailing 10-year annualized returns as of Oct. 31.
Fund
Fidelity Growth Discovery Fund (FDSVX)
Fidelity Nasdaq Composite Index Fund (FNCMX)
Fidelity Trend Fund (FTRNX)
Fidelity Select Tech Hardware Portfolio (FDCPX)
Fidelity OTC Portfolio (FOCPX)
Fidelity Blue Chip Growth Fund (FBGRX)
Fidelity Select Technology Portfolio (FSPTX)
Fidelity Select Semiconductors Portfolio (FSELX)
Fidelity Growth Discovery Fund (FDSVX)
“Growth stocks are those that are growing or are expected to grow earnings at an above-average rate, for which investors are willing to pay a premium,” says Daniel Dusina, chief investment officer at wealth management firm Blue Chip Partners Inc. “The last 10 years, which consisted of ultra-low interest rates and a relatively stable domestic economy, aligned well for growth stocks.”
A concentrated, tech-heavy portfolio has helped FDSVX outperform both the Morningstar large-cap growth peer category and the Russell 3000 Growth Index in recent years. However, the fund charges a fairly pricey 0.62% expense ratio, which is no longer as competitive for active management. A high 60% turnover rate also occasionally results in sizable capital gains distributions at year-end, which are taxable.
10-year annualized return: 17.6%
Fidelity Nasdaq Composite Index Fund (FNCMX)
Over the past decade, the Nasdaq-100 has outpaced the S&P 500 thanks to its heavier weighting in technology and communication services stocks. The broader Nasdaq composite, which includes thousands of additional listings beyond the top 100, has followed a similar path of outperformance. Fidelity offers exposure to this benchmark through FNCMX.
Unlike Nasdaq-100 tracking funds, FNCMX holds over 2,900 additional mid- and small-cap Nasdaq-listed companies and includes a modest allocation to financials. The result is broader diversification with a continued emphasis on technology and innovation. As a passively managed index fund, FNCMX keeps costs low, charging a 0.29% expense ratio and maintaining a low 5% turnover rate.
10-year annualized return: 17.7%
Fidelity Trend Fund (FTRNX)
Every year over the past decade, market experts have warned of an impending crash or bear market. Aside from brief setbacks like the COVID-19 sell-off in March 2020 and the 2022 bear market, those predictions have repeatedly been proven wrong as the bulls have kept control. In many ways, the persistence of tech-driven, mega-cap-led, growth-stock dominance has itself become a trend.
In investing, this kind of long-lasting momentum is what many professionals aim to recognize and follow. Fund managers at Fidelity understand this dynamic and offer FTRNX as an actively managed, concentrated portfolio designed to back the winners expected to keep outperforming. While this approach carries the risk of herding and overexposure to crowded trades, it has delivered strong results.
10-year annualized return: 18.3%
Fidelity Select Tech Hardware Portfolio (FDCPX)
“Overall, growth and information technology have come to dominate the U.S. market over the trailing 10-year period,” Dusina says. “Funds with high exposure to tech heavyweights such as Apple, Microsoft and Nvidia were rewarded with market-leading returns.” However, some international-focused technology sector funds like FDCPX have also experienced good success without a U.S. overweight.
The largest holding in FDCPX’s portfolio is currently Japanese electronics manufacturer Sony Group Corp. (6758.T), at a 10% weight. Closely behind is Korean electronics conglomerate Samsung Electronics Co Ltd. (005930.KS), in third place at a 9.2% weight. Other notable foreign holdings include Taiwan Semiconductor Manufacturing Co Ltd. (TSM) and Nintendo Co Ltd. (7974.T)。
10-year annualized return: 19.3%
Fidelity OTC Portfolio (FOCPX)
Actively managed funds often face criticism for their higher turnover, which can trigger taxable capital gains distributions, and for their pricier expense ratios, which act as a steady drag on performance. However, one clear advantage they hold over index funds is flexibility. That’s exactly what FOCPX does, with the ability to tap out-of-benchmark opportunities unavailable to index-based strategies.
While the majority of its holdings are Nasdaq-listed companies and the fund maintains a 25% or higher overweight to the technology sector, FOCPX can also selectively invest in over-the-counter (OTC) stocks. These aren’t speculative penny stocks – they’re established international firms that choose to list OTC in the U.S. to avoid the full reporting requirements of major exchanges.
10-year annualized return: 19.3%
Fidelity Blue Chip Growth Fund (FBGRX)
One of Fidelity’s longest-running active funds, FBGRX dates back to December 1987. Its mandate has remained consistent: Invest in “well-known, well-established and well-capitalized” companies with above-average growth potential. Since 2009, the fund has been managed by Sonu Kalra, whose stock selection has helped it consistently outperform the S&P 500 during his tenure.
FBGRX is a common option in many workplace 401(k) retirement plans, but its 0.61% expense ratio can be a drawback for cost-conscious investors. A more accessible and cost-effective alternative is the Fidelity Blue Chip Growth ETF (FBCG), which follows the same strategy at a slightly lower 0.59% expense ratio, but with better tax efficiency when it comes to capital gains distributions.
10-year annualized return: 19.6%
Fidelity Select Technology Portfolio (FSPTX)
Investors need to ask whether a fund’s outperformance reflects genuine stock selection skill or simply concentration in a winning sector. For example, FSPTX has easily outpaced the S&P 500 over the past decade. However, that comparison isn’t entirely fair – the S&P 500 includes a mix of sectors like energy, health care, consumer staples and financials, while FSPTX focuses entirely on technology.
Naturally, during a tech-driven bull market, a pure tech fund will appear to outperform a diversified benchmark. A more accurate comparison is against the MSCI US IMI Information Technology 25/50 Index, which better represents the fund’s peer category. On that basis, FSPTX’s edge is decreased, with the fund only slightly outpacing the index over the past 10 years.
10-year annualized return: 23.3%
Fidelity Select Semiconductors Portfolio (FSELX)
A secular tailwind refers to a long-term growth trend that persists regardless of short-term market cycles. Semiconductors are a good example. What began with demand for GPUs in video games expanded to chips embedded in the “Internet of Things,” followed by a boom in cryptocurrency mining, and now the surge in AI, data centers and cloud-based hyperscalers.
Unsurprisingly, FSELX ranks among the top performers across Fidelity’s 302 mutual funds over the past 10 years. The fund’s heavy exposure to U.S.-based semiconductor leaders – most notably Nvidia, which alone makes up 26% of the portfolio – has powered much of that success, though it also adds significant concentration risk for new investors. The fund charges a 0.62% expense ratio.
10-year annualized return: 30.9%